A Inventory of Geological Resources of Indian Coal as on 1st April 2016
The inventory of Geological Resources of Indian Coal (as on 01.04.2016), prepared by the Geological Survey of India on the basis of resources estimated by CMPDI, MECL, GSI, SCCL and some Private/Public Entrepreneurs is enclosed for kind information. The highlights of the inventory are
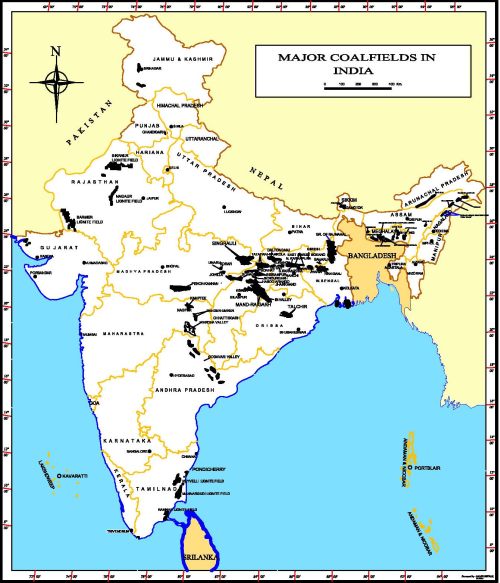
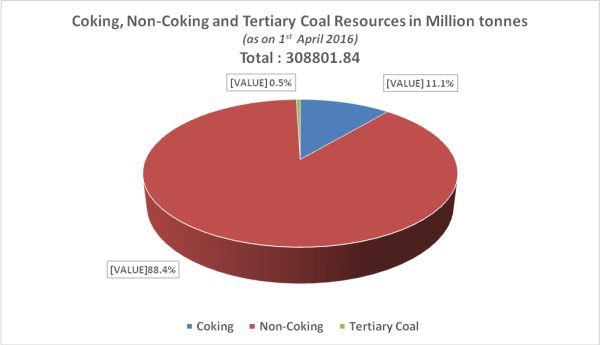
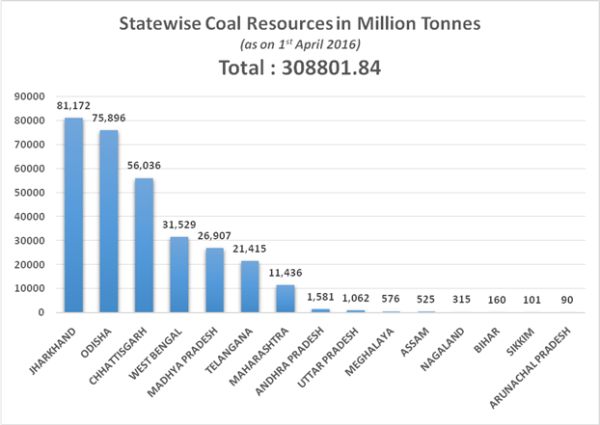
1. A total of 3,08,801.84 Mt of geological resources of coal have so far been estimated in India, upto the maximum depth of 1200 m. Out of the total resources, the Gondwana coalfields account for 3,07,309.20 Mt (99.5%), while the Tertiary coalfields of Himalayan region contribute 1492.64 Mt (0.5%) of coal resources. The type-wise and category-wise break-up is given below:
(Resource in million tonnes)
Coal Type
Measured/Proved
Indicated
Inferred
Total
% share
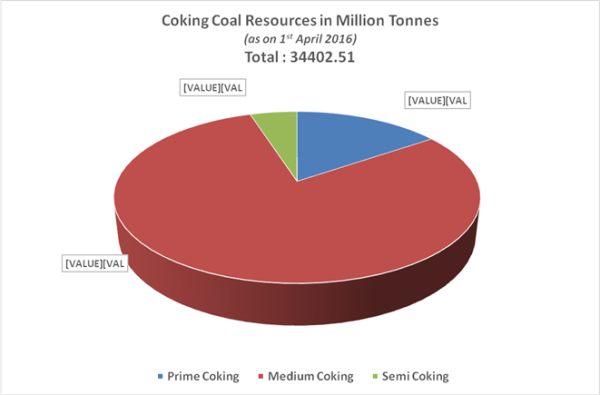
Prime Coking
4614.35
698.71
0
5313.06
1.72
Medium Coking
13388.9
12113.56
1879.47
27381.93
8.87
Semi Coking
482.16
1003.68
221.68
1707.52
0.55
Sub-Total of Coking
18485.41
13815.95
2101.15
34402.51
11.14
Non-Coking
119007.98
125235.58
28663.13
272906.69
88.38
Tertiary Coal
593.81
99.34
799.49
1492.64
0.48
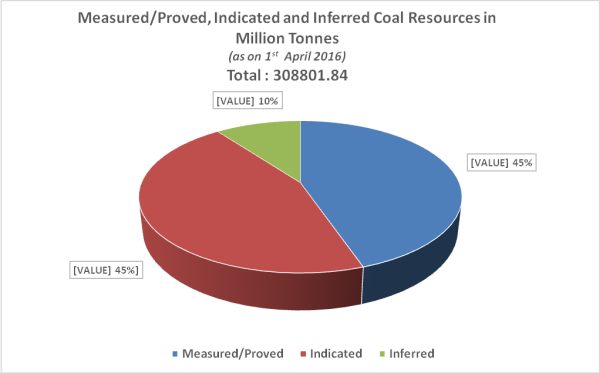
Grand Total
138087.2
139150.87
31563.77
308801.84
100
% share
44.72
45.06
10.22
100
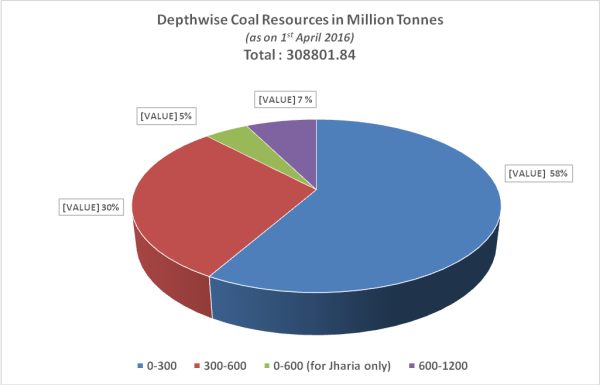
2. The depth-wise and category-wise break-up of Indian coal resources is as follows:
(Resource in million tonnes)
Depth Range (m)
Measured/Proved
Indicated
Inferred
Total
% share
0-300
103623.58
66761.38
9405.4
179790.36
58.22
300-600
18007.39
57937.57
15943.74
91888.7
29.76
0-600 (for Jharia only)
13760.73
451.69
0
14212.42
4.6
600-1200
2695.5
14000.23
6214.63
22910.36
7.42
Total
138087.2
139150.87
31563.77
308801.84
100
3. The estimation of total resources of coal, as on 1st April 2016, has increased by 2,206.28 Mt as compared to last year whereas ‘Measured/Proved Resources’ has increased by 6,473.13 Mt, as shown in table below:
(Resource in million tonnes)
Inventory as on
Measured/Proved
Indicated
Inferred
Total
1st April 2016
138087.2
139150.87
31563.77
308801.84
1st April 2015
131614.07
143241.1
31740.39
306595.56
Difference
6473.13
-4090.23
-176.62
2206.28
4. The increase in ‘Measured/Proved Resources’ in Inventory of 1st April 2016 is mainly due to proving of coal resources in Talcher (3,547.70 Mt), North Karanpura (810.22 Mt), Mand Raigarh (608.97 Mt), Singrauli (495.46 Mt), Godavari Valley (321.93 Mt), Kamptee (254.54 Mt), Korba (226.12 Mt), Raniganj (83.89 Mt), Sonhat (63.66 Mt), South Karanpura (49.54 Mt) and Pench-Kanhan (11.10 Mt) coalfields.